Showing posts with label Video. Show all posts

Sunday, April 4, 2010

Aqua Satellite Project, Update 6 Released


Update 6 for the Aqua Satellite Project is ready. You can download it here. The big item is the new LiveGraph program which creates a movie of a graph. This movie can be overlaid on top of GridToMap movies.

A sample LiveGraph movie is shown below. It graphs cloud and surface temperature data over a map of clouds.

Movie made from LiveGraph and GridToMap.


In support to LiveGraph, a graphics engine, a charting engine, and a platform-independant font engine have been added to the code. There was also some reworking of the MathUtils.h file to make it a lot smaller. Most of the code was moved to a new Math folder.

All code has been placed in the public domain.

Monday, March 29, 2010

What Ozone Hole?


As a result of now being able to make movies from gridded data, I've been going through the ISCCP data that comes with the Climate Scientist Starter Kit. A movie of the ozone data is provided above.

What surprised me was the amount of ozone over Antarctica was equal to or greater than the amount of ozone over nearly the entire rest of the world. Only the Arctic consistently had more ozone (and it has quite a bit of ozone). This was true from the beginning of the movie (July, 1983) to the end (June, 2008).

Which makes me wonder why we've never heard of of an ozone hole over Africa, or South America, or India, all of which always have less ozone than Antarctica.

Now, I'm hardly an ozone expert. So if anyone out there would like to enlighten me on why this all makes sense, please feel free to do so. Because right now I'm wondering if the Ozone Hole is as big a hoax as Global Warming. Tips on why the Arctic has so much ozone are also welcome.

P.S.
If you watch the video all the way through, you get to see what happens when a satellite sensor goes batty.

Sunday, March 28, 2010

Aqua Satellite Project, Update 5 Released


Movie made from GridToMap images.

Update 5 for the Aqua Satellite Project is ready. You can download it here. The big item is the new GridToMap program which lets you create bitmap images from gridded data.


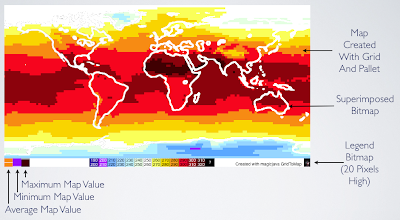
GridToMap takes various pieces of input data and creates an output bitmap. The inputs are:

• Climate data for the entire world in 2.5 by 2.5 degree gridded format. This is a .cvs file with 1 optional header row and 3 required header columns.
• A text pallet file describing which colors get assigned to which ranges of data.
• A legend bit map that can display whatever information you want, but is intended to show the image's legend. The legend bitmap must be 20 pixels high and the same width as the main map image.
• An optional superimpose bitmap that will be laid over the map. The superimpose image must be the same width and height as the map (not counting the 20 pixels for the legend).
• The map can begin at the Prime Meridian or the International Date Line.
• Optionally, average, minimum, and maximum values for the map can be displayed as thumbnails in the left 60 pixels of the legend.

There are three related scripts: grid_to_map, grid_to_movie, and grid_to_movie_with_filename. All three of these scripts scan immediate subdirectories looking for .csv files and run GridToMap against any they find. They differ only in how they name the output files. grid_to_map simply appends ".bmp" to the new filename. grid_to_movie uses "movie" with a sequence number and ".bmp". grid_to_movie_with_filename prepends "movie", a sequence number, three under-bars, the filename, the sequence number (again) and ".bmp".

Sample grids, pallets, legends, and overlays are included with the download in the GridToMap folder. For additional details, see the version log that comes with the download.

Friday, March 26, 2010

Saturday, March 20, 2010

One Month Of AMSU Channel 5 Data


This video shows 1 month of Aqua AMSU Channel 5 data as it was displayed during one of my debugging sessions. The video is kinda blurry due to low resolution, but don't worry, you wouldn't be able to read all the data scrolling by even at HD resolution. Enjoy :)

Update:
Here's a screen shot of the end of the video in better resolution so you can see the data is nothing but the numeric readings from the channel.

Thursday, January 28, 2010

Climate Scientist Starter Kit Working With Curves


Shows how to use the Climate Scientist Starter Kit to work with curves so common to climate data.

This video has been placed in the public domain.

Friday, January 8, 2010

Climate Scientist Starter Kit, Version 1.5


The Climate Scientist Starter Kit has been updated to version 1.5. There's lots of new data and this video explains what you'll find.

This video has been placed in the public domain.

Sunday, January 3, 2010

Climate Scientist Starter Kit Simple Data Analysis


This video shows you how to do some simple data analysis with the Climate Scientist Starter Kit spreadsheet. It includes an example of re-creating Svensmark's cosmic ray and tropospheric temperature graph.

This video has been placed in the public domain.

Saturday, January 2, 2010

Climate Scientist Starter Kit Introduction Video


This video is a walkthrough and explanation of the data found in the Climate Scientist Starter Kit spreadsheet.

The video has been placed in the public domain.

Friday, December 25, 2009

Cosmic Rays And Climate. Part V: Cosmoclimatology


This video has been placed in the public domain.

Tuesday, December 22, 2009

Cosmic Rays And Climate. Part IV: CO2 Global Warming


This video has been placed in the public domain.

Monday, December 21, 2009

Cosmic Rays And Climate. Part III: Clouds


This video has been placed in the public domain.

Sunday, December 20, 2009

Cosmic Rays And Climate. Part II: Plasma Physics


This video has been placed in the pubic domain.

Friday, December 18, 2009

Cosmic Rays And Climate. Part I: Quantum Physics


This video has been placed in the public domain.

Tuesday, December 15, 2009

Updated (Again) Cap And Trade Video


New information keeps pouring in about the seedy connections that make up "Cap and Trade". This one includes info on the head of the IPCC.

This video has been placed in the public domain.

Sunday, December 13, 2009

R.I.P. AGW 1988 - 2009

'

This video has been placed in the public domain.

Saturday, December 12, 2009

Updated Cap And Trade Video


The new version includes information recently obtained via the Freedom of Information Act.

This video has been placed in the public domain.

Friday, December 11, 2009

ClimateGate And The Mainstream Media


Examines possible reasons the MSM is trying to ignore ClimateGate.

This video has been placed in the public domain.

Thursday, December 10, 2009

Happy Fun Ball


This video has been placed in the public domain.

Tuesday, December 8, 2009

I'm Sorry


The video and images have been placed in the public domain.

References
Goldman Sachs
Deutsche Bank
Société Générale