Showing posts with label HDF-EOS. Show all posts

Monday, February 8, 2010

HDF Reader C++ Code Is Written!

The code to read HDF files is up. The code should be considered a beta release, not so much because of the quality (the code is actually pretty good, if I do say so myself), but because I reserve the right to modify it in the near future.

After having various problems with the code NASA supplies (missing libraries, pre-built binaries that don't link), I decided to just write the reader myself. This post will take a quick look at the code. A follow up post will show some of the results of using the code to read raw UAH data.

The code has been placed in the public domain and you can get it here:
HDFReader.h
HDFReader.cpp

Previous Posts In This Series
Prepping The Data File
The AMSR code reads un-compacted ASCII files, and HDF file are compacted binary. So you'll need to change that before reading them with the code. To do that, just use the ncdump tool. The only argument you supply to ncdump in this case is the filename. Redirect the output to a file and use that file as input to the code. And example command line is shown below:

ncdump AIRS.2010.01.01.240.L1B.AMSU_Rad.v5.0.0.0.G10005063822.hdf > MyFile.txt

If you don't yet have ncdump on your computer, see this post for instructions on downloading and using it.

The Code
The underlying code is fairy complex, so we'll skip discussing it. The code is well commented, so you can look there for specific details. Here we'll just discuss how to use the code to read data.

The code sample below shows how to create the reader, declare memory to hold data you'll get from the reader, and read the raw antenna temperatures.

// Supply location of HDF file.
HDFReader oHDFReader(string("./MyFile.txt"));
// 45 scan lines, 30 footprints, 15 channels.
float aData[45][30][15];

// Load data.
oHDFReader.getVariableData(string("antenna_temp"), aData);


Yup. That's it. Of course, with this version of the code, you need to know that the name of the antenna temperature data is antenna_temp and that it's an array of floats 45 by 30 by 15. Fear not. You can open the ASCII version of the HDF file and see all the variables listed in the variables section near the beginning of the file. These variables will have dimensions listed as constants and those constants are defined in the dimensions section at the beginning of the file.

There's also some hierarchical data in the HDF file and that data is stored in a node structure in HDFReader. To get the root of the node structure, use the getRootNode() method.

Future versions of the code will build on what's here now. Specifically, I want to add methods to access the variables without forcing the programmer to dig through the data file to see what variables are there. Code to do that should be ready soon.

Also coming soon is a look at some of the raw UAH data that gets extracted from these files.

References:
Some Useful Climate Code

Monday, February 1, 2010

Aqua Satellite Raw AMSR-E Data


In this post we take a look at the AMSR-E Level 2A data. Specifically, we now want to be able to write pseudocode that reads the file, checks for errors, and grabs the raw temperature data. In order to get to this level of understanding of the data, we're going to use the Level 2A Data Fields web page. It describes the fields in the Level 2A data file for the AMSR-E instrument.

Additional Posts In This Series
Aqua Satellite Data Processing
A Note On The UAH And RSS Raw Data
How UAH And RSS Temperatures Are Measured
Overview Of The Aqua Satellite
Looking At The Aqua Satellite Data
UAH Satellite Data
Dangit! More Climate Stuff. UAH and RSS Raw Data

Scan Information
Each AMSR-E Level 2A data file contains a singe scan at low resolution and a single scan at high resolution.

For low resolution, the AMSR-E scans 1994 times in the same direction as the satellite is moving. Each of these 1994 scans contains 243 readings perpendicular to the movement of the satellite (called Footprints), and each of these 243 readings contains 5 channels, each at a different frequency.

This gives a total of 2,422,710 readings in a single Level 2A file. This data has been "smoothed" as part of its processing from Level 1B to Level 2A.

For high resolution scans the AMSR-E scans 1994 times in the same direction as the satellite is moving. Each of these 1994 scans contains 486 readings perpendicular to the movement of the satellite, and each of these 486 readings contains 1 channel at a frequency of 89.0 GHz.

This gives a total of 969,084 readings in a single Level 2A file. This data has not been smoothed. It's in its original Level 1B form.

NOTE: The high resolution scans were designed to be collected by two "horns" on the AMSR-E instrument, called Horn A and Horn B. However, recall from this post that Horn A failed on November 11th, 2004. A software change was made to gather all high resolution data from Horn B. Horn A still has data fields in the level 2A file, but they are all set to -32,768.

NOTE: Both the low resolution and high resolution temperatures are stored in a scaled offset format. To obtain the actual temperature in degrees Kelvin multiply the stored values by 0.01 and add 327.68 to the result.

Data Quality

There are several fields in the AMSR-E Level 2A data file that contain the results of Quality Assurance (QA) checks. These fields tell if various pieces of data in the file can be used with confidence. Here are the important QA fields to check when processing temperature data:

For Low Resolution Scans
  • Scan Quality Flag A series of 1994 flags indicating the quality of each scan line. If a flag is not zero, the corresponding scan line should be rejected.
  • Channel Quality Flag 6 To 52 A series of 1994 arrays containing 12 flags each. There are two flags for channels 6.9, 10.7, 18.7, 23.8, and 36.5. The last two fields are not used as there is no channel 52. These flags indicate the horizontal and vertical scan validity for each scan footprint. If either flag for a footprint is not zero, the corresponding footprint should be rejected.

For High Resolution Scans
There are two high resolutions scans in the Level 2A file, one for Horn A and one for Horn B. Horn A is broken and its data should be ignored.
  • Scan Quality Flag 89B A series of 1994 flags indicating the quality of each scan line for Horn B. If a flag is not zero, the corresponding scan line should be rejected.
  • Channel Quality Flag 89B A series of 1994 arrays containing 2 flags each. These flags indicate the horizontal and vertical scan validity for each scan footprint. If either flag for a footprint is not zero, the corresponding footprint should be rejected.

Pseudocode For Reading Raw AMSR-E Data
The following pseudocode shows how to process a AMSR-E Level 2A file, checking for QA errors, and grabbing the temperature data. Recall that temperatures are provided in scaled offset degrees Kelvin and that Horn A is always bad.


Open File
Read Low Resolution Record Into Memory

Foreach Of The 1994 Scanlines
   If Scan Quality Flag Is Not 0 Then Reject Scanline

   Foreach Of The 5 Footprints
      If Either Of The Channel Quality Flags Are Not 0 Then Reject Footprint

      Read Each Of The 243 Footprints For the Channel
   End Foreach
End Foreach

Read High Resolution Horn B Record Into Memory

Foreach Of The 1994 Scanlines
   If Scan Quality Flag Is Not 0 Then Reject Scanline

   If Either Of The Channel Quality Flags Are Not 0 Then Reject Footprint

   Read Each Of The 486 Footprints For the Channel
End Foreach


References:

Sunday, January 31, 2010

Aqua Satellite Raw UAH Data, Part 2

In this post we take a more detailed look at the AMSU Level 1B data that serves as the raw data for UAH. Specifically, we now want to be able to write pseudocode that reads the file, checks for errors, and grabs the raw temperature data. In order to get to this level of understanding of the data, we're going to use the AIRS Version 5.0 Released Files Description PDF. It contains a section for each AIRS instrument on the Aqua satellite and each section describes every field in the Level 1B data file for that instrument.

Additional Posts In This Series
Aqua Satellite Data Processing
A Note On The UAH And RSS Raw Data
How UAH And RSS Temperatures Are Measured
Overview Of The Aqua Satellite
Looking At The Aqua Satellite Data
UAH Satellite Data
Dangit! More Climate Stuff. UAH and RSS Raw Data


Scan Information
Each AMSU Level 1B data file contains a a collection of scans that take place over 6 minutes.

In these 6 minutes, the AMSU scans 45 times in the same direction as the satellite is moving. Each of these 45 scans contains 30 readings perpendicular to the movement of the satellite (called Footprints), and each of these 30 readings contains 15 channels, each at a different height above the Earth's surface.

NOTE: These values are collected by three different pieces of hardware. Receiver A11 handles channels 6, 7, and 9 through 15. Receiver A12 handles channels 3, 4, 5, and 8. Receiver A2 handles channels 1 and 2. Also, recall from Part 1 that channel 7 is always bad. 

This gives a total of 20,250 readings in a single Level 1B file. These 20,250 readings are stored as a contiguous block of data in the file that, in the parlance of C programmers, can be read into computer memory as a three dimensional array.

There are actually two sets of this 20,250 piece block of information in the AMSU Level 1B files. The first set is called antenna temperatures and is the raw data in degrees Kelvin as read by the satellite modified by calibration information (specifically, antenna temperatures = calibration coefficient/instrument readings2).

The second set is called brightness temperatures consists of slightly modified antenna data.The brightness temperatures have a companion set of data, 20,250 error estimates called brightness temperature errors that estimate the accuracy of the brightness temperatures.

Either the antenna temperatures or the brightness temperatures can be considered to be the raw data used to create the UAH data.

Data Quality
There are several fields in the AMSU Level 1B data file that contain the results of Quality Assurance (QA) checks. In fact, much of the file is QA data. These fields tell if various pieces of data in the file can be used with confidence. Here are the important QA fields to check when processing temperature data:
  • State 1 Indicates the state of the AMSU-A1 unit for each scan line. If this value is anything other than 0, the data in the scan line should be rejected.
  • QA Receiver A11 and QA Receiver A12 These flags indicate the quality of the AMSU temperature receivers for each scan line. If either are non-zero, the data in the scan line should be rejected.
  • SATGEO QAGLINTGEO QA, and MOONGEO QA These fields contain QA information for each scan line. If a non-zero value is present, the data in the corresponding field should be rejected. 
  • FTPTGEO QA, ZENGEO QA, and DEMGEO QA These are satellite position QA flags and occur for each of the 30 field of view footprints for each of the 45 scan lines. If a non-zero value is present, the data in the corresponding field should be rejected. 
  • QA Channel This is a series of 15 flags indicating the reliability of each channel of the AMSU. Channels with non-zero values should not be used. Recall from Part 1 that channel 7 is always bad. 
Pseudocode For Reading Raw UAH Data
The following pseudocode shows how to process a AMSU Level 1B file, checking for QA errors, and grabbing the temperature data. Recall that temperatures are provided in degrees Kelvin and that channel 7 is always bad.

Open File
Read AMSU Record Into Memory

Foreach Of The 45 Scanlines
   If State_1 Not Equal To 0 Then Reject Scanline
   If QA_Receiver_A11 Not Equal To 0 Then Reject Scanline
   If QA_Receiver_A12 Not Equal To 0 Then Reject Scanline
   If SATGEO_QA Not Equal To 0 Then Reject Scanline
   If GLINTGEO_QA Not Equal To 0 Then Reject Scanline
   If MOONGEO_QA Not Equal To 0 Then Reject Scanline

   Foreach Of The 30 Footprints
      If FTPTGEO_QA Not Equal To 0 Then Reject Footprint
      If ZENGEO_QA Not Equal To 0 Then Reject Footprint
      If DEMGEO_QA Not Equal To 0 Then Reject Footprint

      Foreach Of The 15 Channels
         If QA_CHANNEL Not Equal To 0 Then Reject Channel

         Read Antenna Temperature for this Scanline/Footprint/Channel
         Read Brightness Temperature for this Scanline/Footprint/Channel
         Read Brightness Temperature Error for this Scanline/Footprint/Channel
      End Foreach
   End Foreach
End Foreach


References:
Aqua Satellite Raw UAH Data, Part 1
Aqua Satellite Data Processing
A Note On The UAH And RSS Raw Data
How UAH And RSS Temperatures Are Measured
Overview Of The Aqua Satellite
Looking At The Aqua Satellite Data
UAH Satellite Data
Dangit! More Climate Stuff. UAH and RSS Raw Data
AIRS Version 5.0 Released Files Description

Saturday, January 30, 2010

Aqua Satellite Raw UAH Data, Part 1

In this post we're going to start looking at the details of the data inside the AMSU Level 1B file that contains the raw data used to generate UAH temperatures. When downloading the data from NASA a PDF named README.AIRABRAD.pdf describing the data is included in the download and also available here. We'll be using that PDF extensively to understand the data.

Additional Posts In This Series
Satellite Summary
Aqua Satellite Data Processing
A Note On The UAH And RSS Raw Data
How UAH And RSS Temperatures Are Measured
Overview Of The Aqua Satellite
Looking At The Aqua Satellite Data
UAH Satellite Data
Dangit! More Climate Stuff. UAH and RSS Raw Data

Background
The Level 1B AMSU products contain calibrated and geolocated brightness temperatures in degrees Kelvin. The file format is currently at version 5. Version 5 first appeared in June, 2007. Highlights of the changes from Version 4 to version 5 are provided below.

• Improved Quality Indicators and Error Estimates
• Correction to Saturation and Relative Humidity
• Correction to Outgoing Longwave Radiation
• Improved O3 Product
• Addition of CO and CH4 Products
• Averaging Kernel, Verticality and Degrees of Freedom
• AMSU-A Level 1B Sidelobe Correction Implemented
• No HSB data
• Removal of VIS/NIR Derived Cloud Fields
• Preparation of AIRS-Only Processing Option

AMSU-A primarily provides temperature soundings. It is a 15-channel microwave temperature sounder implemented as two independently operated modules. Module 1 (AMSU-A1) has 12 channels in the 50-58 GHz oxygen absorption band which provide the primary temperature sounding capabilities and 1 channel at 89 GHz which provides surface and moisture information. Module 2 (AMSU-A2) has 2 channels: one at 23.8 GHz and one at 31.4 GHz which provide surface and moisture information (total precipitable water and cloud liquid water).

The AMSU-A has the three receiving antennas, two for AMSU-A1 and one for AMSU-A2, that are parabolic focusing reflectors mounted on a scan axis at a 45° Tilt angle, so that radiation is reflected from a direction along the scan axis (a 90° reflection). AMSU-A scans three times as slowly as AIRS (once per 8 seconds) and its footprints are approximately three times as large as those of AIRS (45 km at nadir). This result in three AIRS scans per AMSU-A scans and nine AIRS footprints per AMSU-A footprint.

There are 240 files that make up each days measurements. Each file is about 0.5 MB in size.

AMSU Channel 7 has a high level of noise and should not be used.

Key Data Concepts
HDF-EOS: The HDF file format is NASA's standard file format for storing data from the Earth Observing System (EOS), which is the data gathering system of sensors (mainly satellites) supporting the Global Climate Change Research Program. The Aqua satellite uses a specialized form of HDF called HDF-EOS, which deals specifically with the kinds of data that EOS produces.

Swath: The swath concept for HDF-EOS is based on a typical satellite swath, where an instrument takes a series of scans perpendicular to the ground track of the satellite as it moves along that ground track (see diagram at left). As the AIRS is profiling instrument that scans across the ground track, the data would be a three dimensional array of measurements where two of the dimensions correspond to the standard scanning dimensions (along the ground track and across the ground track), and the third dimension represents a range from the sensor. The "horizontal" dimensions can be handled as normal geographic dimensions, while the third dimensions can be handled as a special "vertical" dimension.

Major Data Groups
The AMSU Level 1B file is made of four major groups; “Dimensions”, “geolocation fields”, “Attributes”, and “Data fields” with data fields sub-divided into “Per-Granule Data Fields”, "Along-Track Data Fields, and “Full Swath Data Fields”.

Dimensions: These are HDF-EOS swath dimensions. The names "GeoTrack" and "GeoXTrack" have a special meaning for this document: "GeoTrack" is understood to be the dimension along the path of the spacecraft, and "GeoXTrack" is the dimension across the spacecraft track, starting on the left looking forward along the spacecraft track. There may also be a second across-track dimension "CalXTrack," equivalent to "GeoXTrack," except that "CalXTrack" refers to the number of calibration footprints per scanline. "GeoTrack" is 45 for large-spot products (AMSU-A, Level-2, cloud-cleared AIRS) and 135 for small-spot products (AIRS, Vis/NIR, HSB).

Geolocation Fields: These are all 64-bit floating-point fields that give the location of the data in space and time. If the note before the table specifies that these fields appear once per scanline then they have the single dimension "GeoTrack." Otherwise, they appear once per footprint per scanline and have dimensions "GeoTrack,GeoXTrack."

Attributes: These are scalar or string fields that appear only once per granule (a granule is a file). They are attributes in the HDF-EOS Swath sense.

Per-Granule Data Fields: These are fields that are valid for the entire granule (a granule is a file) but that are not scalars because they have some additional dimension.

Along-Track Data Fields: These are fields that occur once for every scanline. These fields have dimension "GeoTrack" before any "Extra Dimensions." So an "Along-Track Data Field" with "Extra Dimensions" of "None" has dimensions "GeoTrack"; whereas, if the "Extra Dimensions" is "SpaceXTrack (= 4)," then it has dimensions “GeoTrack,SpaceXTrack."

Key Data Fields
Location Data Fields
• Latitude: Boresight geodetic latitude (degrees North, -90->+90), dimension (90,135)
• Longitude: Boresight geodetic longitude (degrees East, -180->+180), dimension (90,135)
• Time: Footprint "shutter" TAI Time: floating-point elapsed seconds since Jan 1, 1993

Per-Granule Data Fields
• center_freq: Channel center frequency (GHz), dimension (15)
• IF_offset_1: Offset of first intermediate frequency stage (MHz) (zero for no mixing), dimension (15)
• IF_offset_2: Offset of second intermediate frequency stage (MHz) (zero for no second mixing), dimension (15)
• Bandwidth: Bandwidth of sum of 1,2 or 4 channels (MHz), dimension (15)
• NeDT: Instrument noise level estimated from warm count scatter (15)

Along-Track Data Fields
• qa_scanline: Bit field for each scanline (bit 0 set if sun glint in scanline; bit 1 set if costal crossing in scanline, bit 2 set if some channels had excessive NeDT estimated), dimension (45)
• qa_channel: Bit field by channel for each scanline (bit 0 set if all space view counts bad; bit 1 set if space view counts marginal; bit 2 set if space view counts could not be smoothed; bit 3 set if all blackbody counts bad; bit 4 set if blackbody counts marginal; bit 5 set if blackbody counts could not be smoothed; bit 6 set if unable to calculate calibration coefficients; bit 7 set if excessive NeDT estimated), dimension (15,45)

Swath Data Fields
• antenna_temp: Calibrated, geolocated channel-by-channel AMSU observed raw antenna temperature (K), dimension (15,30,45)
• brightness_temp: Calibrated, geolocated channel-by-channel AMSU sidelobe-corrected antenna temperature (K), dimension (15,30,45)
• brightness_temp_err: Error estimate for brightness_temp (K), dimension (15,30,45)
• landFrac: Fraction of AMSU footprint that is land (0.0 -> 1.0), dimension (30,45)
• landFrac_err: Error estimate for landFrac, dimension (30,45)

References:
Satellite Summary
Aqua Satellite Data Processing
A Note On The UAH And RSS Raw Data
How UAH And RSS Temperatures Are Measured
Overview Of The Aqua Satellite
Looking At The Aqua Satellite Data
UAH Satellite Data.html
Dangit! More Climate Stuff. UAH and RSS Raw Data
README Document for AIRS Level-1B Version 5 AMSU-A Calibrated Brightness Temperature products: AIRABRAD, AIRABRAD_NRT
AIRS/AMSU/HSB Version 5 Changes from Version 4
AIRS/AMSU/HSB Version 5 Data Disclaimer

Sunday, January 17, 2010

Dangit! More Climate Stuff. UAH and RSS Raw Data

UPDATE:
It turns out the data described in this post is used to determine ice and other terrestrial, atmospheric, and oceanic variables, not RSS data. To the best of my knowledge, raw RSS data isn't available online. See this post for more information.
=================

Well, so much for getting back to my physics code. There seems to be a hole in the sceptic community's understanding of raw UAH temperature data. I really think this hole needs to be filled and I think I'm going to have to be the one to fill it. I'm going to post the steps I'm taking along the way. This way there's a written trail for others in the community to follow if they want to. It'll also give anyone out there who's familiar with raw UAH temperature data the chance to tell me if I'm going off into the weeds, or if there's a better way to do what I'm doing. I'm hardly a "satellite raw data expert", so if someone out there sees me making a mistake, don't be shy pointing it out. :)

This post describes how to get the raw data, what format that data is in, and how to get a few utilities for working with the data. So, here we go...

UAH And RSS Data
First of all, what is UAH and RSS data? They're both satellite data, one comes from the University of Alabama, Huntsville (UAH) and the other comes from a company called Remote Sensing Systems (RSS). Both of these data sets are processed data derived from the same raw source. This source is NASA's Aqua satellite. You can read about this satellite and how UAH uses its data in this article at the Watts Up With That Blog.

So if we want the raw data for UAH and RSS, we want the data from the Aqua Satellite.

Getting Aqua Satellite Data
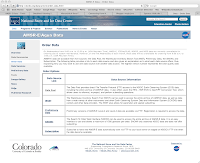
After doing some searching on the net, I found the raw data for the Aqua satellite at the National Snow and Ice Data Center (NSIDC) Order Form. Follow these steps to get the data you're looking for:


On the Order Data Screen, click the Data Pool link.


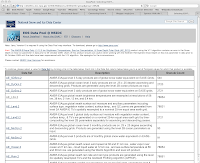
On the DataPool screen, click the AE_L2A.2 link. This contains the AMSR-E/Aqua global swath brightness temperatures data.


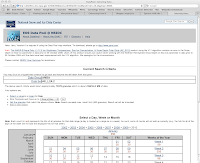
Now you're at the data selection screens. This is a group of screens that let you select the date and time of the data you want, as well as spatial and day/night data. NOTE: Daily data can range in size from 1 to 2.5 GB! So you're not going to want to download tons of data at a time. Stick to small date ranges, probably one or two days.

In this example, I'm interested in the last full day of data, which is currently 12 JAN 2010. At the calendar at the bottom of the screen, I click that date.


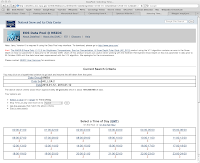
The next screen let's me pick the time of day I'm interested in. I'm interested in the entire day and I don't want to set any day/night or spatial options. So I'm ready to go and can move on to the download screen. I do this by clicking the Get the granules that match the above criteria link in the middle of the screen.


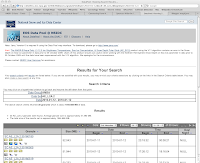
Now I'm at the screen showing the results of the search. At the bottom of this screen is a list of "granules" that matched my search. These granules are the data files to be downloaded. If you look at the top of the Results box at the bottom of the screen, you'll see that the first 10 granules out of 30 granules are being displayed. You'll also see controls for displaying the other granules. There are 30 granules in all and we want all 30.

We start downloading by right-clicking the link to each granule and selecting Download. You can see the links to the granules on the left side of the Results box at the bottom of the screen. The first link in this example is named SC:AE_L2A.2:35160180. There's a row for each granule. Download 10, then go to the 2nd screen, download 10 more, then go to the 3rd screen and download the last 10.

Congratulations, you now have all the raw Aqua data for Jan 12, 2010.

Aqua Satellite Data Format
The Aqua Satellite data files are in a format known as Hierarchical Data Format - Earth Observing System (HDF-EOS). These files contain a mix of binary and text data. The text data is in a hierarchical format that is custom designed by NASA. There's a page at the NSIDC web site that describes this data. It says:

Hierarchical Data Format (HDF) is the standard data format for all NASA Earth Observing System (EOS) data products. HDF is a multi-object file format developed by The HDF Group.
The HDF Group developed HDF to assist users in the transfer and manipulation of scientific data across diverse operating systems and computer platforms, using FORTRAN and C calling interfaces and utilities. HDF supports a variety of data types: n-Dimensional scientific data arrays, tables, text annotations, several types of raster images and their associated color palettes, and metadata. The HDF library contains interfaces for storing and retrieving these data types in either compressed or uncompressed formats.
For each data object in an HDF file, predefined tags identify the type, amount, and dimensions of the data; and the file location of various objects. The self-describing capability of HDF files helps users to fully understand the file's structure and contents from the information stored in the file itself. A program interprets and identifies tag types in an HDF file and processes the corresponding data. A single HDF file can also accommodate different data types, such as symbolic, numerical, and graphical data; however, raster images and multidimensional arrays are often not geolocated. Because many earth science data structures need to be geolocated, The HDF Group developed the HDF-EOS format with additional conventions and data types for HDF files.
HDF-EOS supports three geospatial data types: grid, point, and swath, providing uniform access to diverse data types in a geospatial context. The HDF-EOS software library allows a user to query or subset the contents of a file by earth coordinates and time if there is a spatial dimension in the data. Tools that process standard HDF files also read HDF-EOS files; however, standard HDF library calls cannot access geolocation data, time data, and product metadata as easily as with HDF-EOS library calls.


From a computer programmer's point of view, we've got a custom data format that is extremely flexible but is going to be a bit of a pain to parse. Luckily, NASA provides some tools to make it easier to work with the data.

Tools
There's a page at the NSIDC web site that provides links to a few HDF-EOS tools. One of these tools converts HDF-EOS files to ASCII. I believe this is the tool we're going to want to use.

The tool is called ncdump, and it has its own web page. On that page you'll find instructions for installing and using ncdump on UNIX and Windows platforms. I'm not going to repeat those instructions here. Just follow them and you'll have ncdump as well as several other tools installed on your system, ready to use.

Note that if you're asked for a user ID and password for FTPing the files to your computer, log on to FTP as an anonymous user (Guest) and no password.

Wrapping Up
That's all I'm going to cover for this post. At this point you know about UAH and RSS raw data from the Aqua Satellite. You know where to get that data and how to download it to your computer. And you have a few tools for working with the data.

This is as far as I've gone with the process so far. There's a lot here and I wanted to stop and document the steps I've taken before moving on.

References:
How the UAH Global Temperatures Are Produced
National Snow and Ice Data Center AMSR-E Aqua Data Order Form
NSIDC Introduction to HDF-EOS
NSIDC HDF-EOS tools
NSIDC ncdump Tool Web Page