There are 3 tools we're going to use to look at the data: 1) ncdump, 2) vshow, and 3) HDFView.
If you haven't already downloaded the HDF-EOS tools, you can get them here. The ncdump and vshow tools are located in the "utilities" folder of the download.
You can download HDFView from here. HDFView is a Java program. Unzip and double click the installer to install the program on your computer.
If you haven't read the previous posts in this series, they're located here:
UAH Satellite Data
Dangit! More Climate Stuff. UAH and RSS Raw Data
ncdump
The ncdump tool is a command line utility that converts an hdf file to ASCII text. It has several options, the first of which you should learn is the -H (upper case H) option. This is the help option that gives you information on all the other options available. These options are:
./ncdump [-c|-h|-u] [-v ...] [[-b|-f] [c|f]] [-l len] [-n name] [-d n[,n]] file
[-c] Coordinate variable data and header information
[-h] Header information only, no data
[-u] Replace nonalpha-numerics in names with underscores
[-v var1[,...]] Data for variable(s),... only
[-b [c|f]] Brief annotations for C or Fortran indices in data
[-f [c|f]] Full annotations for C or Fortran indices in data
[-l len] Line length maximum in data section (default 80)
[-n name] Name for netCDF (default derived from file name)
[-d n[,n]] Approximate floating-point values with less precision
file File name of input netCDF file
The -h (lowercase h) option will extract only header information. So this tells us an HDF file has headers and gives us a way to look at what those headers are. I ran ncdump using this option from a terminal window, like so: ./ncdump -h filename | more. A screenshot of the output is shown below.
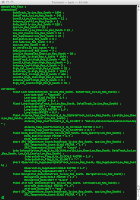
We can see there are headers with names like DataTrack_lo:Low_Res_Swath, Antenna_Coeff:Low_Res_Swath, DataTrack_lo:High_Res_B_Swath, Latitude(DataTrack_lo:Low_Res_Swath, DataXTrack_lo:Low_Res_Swath), and Longitude(DataTrack_lo:Low_Res_Swath, DataXTrack_lo:Low_Res_Swath).
I'd encourage you to run ncdump like this at least once for UAH data and once for RSS data and take the time to scan through the results.
The next option we want to look at is -b. This provides a brief description for data items that are part of indexes (arrays in C-speak). You need to give this option an f or c argument. This indicates whether the data should be presented in a Fortran-like or C-like format. I prefer C over Fortran, so I used this command: ./ncdump -b c filename | more. The first part of the results look a lot like the header results. But scrolling further through the file reveals differences. A screenshot is shown below.
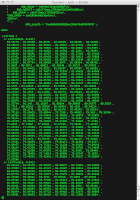
You can see we're now getting values for the headers we saw previously.
The final ncdump command we're going to cover is -f. This is like -b, but gives full descriptions for the data items. Using the command ./ncdump -f c filename | more produces the following results:
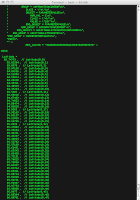
As you can see, every item in an array is commented with its exact location in the array. I have a feeling this kind of output may come in handy during debugging situations.
So the four variants of ncdump we've discussed are:
./ncdump -H
./ncdump -h filename | more
./ncdump -b c filename | more
./ncdump -f c filename | more
These commands will show the Help screen, print out headers, print out data with brief descriptions and print out data with full descriptions.
If you want to save the output to disk, replace | more with > output_filename
vshow
The vshow command produces output similar to ncdump when used with the -h option. That is, vshow produces a list of the headers in the file. However, vshow goes a bit further and shows the sub headers under each header. The output of the command ./vshow filename | more is shown below.
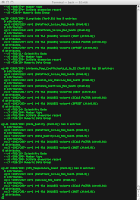
Vshow calls the headers v groups and labels each header as vg #, where # is a sequential number starting with zero. The sub-headers are labeled the same way, with each sub-header number also starting at zero.
HDFView
The final tool we're going to look at is HDFView. This tool provides a graphical interface to HDF files. It shows both headers and data. You can edit the file and save your edits to disk.
To use this tool, double click on it, and select Open from the File menu. Navigate to the file you want to look at and click the Open button. A screen shot of HDFView with a file loaded up is shown below.
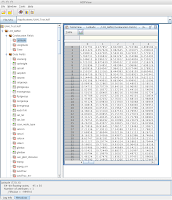
On the left side you see a Tree control showing the headers in the file. Double-clicking a header brings up it's edit window in the main window.
If you make edits to the data they can be saved using the Save or Save As menu items in the File menu.
References:
NSIDC HDF-EOS To ASCII Tools
HDFView
UAH Satellite Data
Dangit! More Climate Stuff. UAH and RSS Raw Data


No comments:
Post a Comment