Monday, August 24, 2009

Custom POOMA Particles And The Standard Model


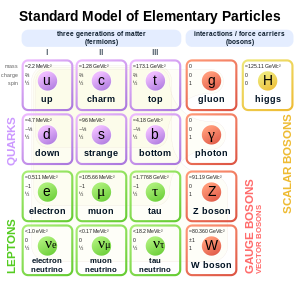
POOMA provides the ability to define custom particles that you can use in your physics simulations. Now, a "particle" in POOMA can be anything, baseballs, planets, imaginary particles, whatever you want. In this post we're going to create definitions for the particles from the standard model of quantum physics. If you want to brush up on the standard model, you can find a good description of it at Wikipedia's Standard Model page. You can download the code being discussed in this post (just one header file) from The POOMA Add-On Project at SourceForge. A short POOMA program that uses these custom particles is here.

IMPORTANT NOTE: While all the main particles from the standard model are created, they are treated in a "classical" manner in the classes we create. That is, their positions, charges, velocities, and so on, are all precisely known.

Extending POOMA's Particle Template
You create a custom particle in POOMA by extending the Particle Template. The class you create can contain any data you'd like. You'll certainly want to store the information that applies to your custom particle type in this class. However, it also seems to be customary to include Vectors of information for all instances of your class where the information changes from particle to particle. For example, because the positions of the instances of your particles will all be different, it's customary to include a Vector in your particle class to store the positions of each particle.

This post will discuss the header file that defines the particles of the standard model. First we will look at the base class, CustomParticle, and then the derived classes.

The CustomParticle Base Class
The CustomParticle class is the base class for all the other classes we'll define. It has a protected constructor, so it can't be instantiated. You'll need to instantiate one of the derived classes.

A description of the members is provided below:

*) getMass() Returns the mass of the particle, measured in MeV.
*) getCharge() Returns the charge of the particle.
*) getSpin() Returns the spin of the particle.
*) getName() Returns the name of the particle. Example names are Electron, Photon, and Charm Quark.
*) getInteractsWithStrong() Returns true if the particle interacts with the strong force, or false if it doesn't.
*) getInteractsWithElectromagnetic() Returns true if the particle interacts with the electromagnetic force, or false if it doesn't.
*) getInteractsWithWeak() Returns true if the particle interacts with the weak force, or false if it doesn't.
*) getInteractsWithGravity() Returns true if the particle interacts with the gravity, or false if it doesn't.
*) getInteractsWithParticle() Pass this function a particle and it will return true if this particle interacts with it, or false if it doesn't.
*) getLifetime() Returns the lifetime of the particle in seconds. A value of -1 means the particle lasts forever.
*) isFermion() returns true if a particle is a fermion, false if it is not.
*) isBoson() returns true if a particle is a boson, false if it is not.
*) isQuark() returns true if a particle is a quark, false if it is not.
*) isLeption() returns true if a particle is a lepton, false if it is not.
*) DynamicArray< PointType_t, AttributeEngineTag_t > pos This is an array that will store all the positions of particles of a given type.
*) DynamicArray< PointType_t, AttributeEngineTag_t > vel; This is an array that will store all the velocities of particles of a given type.
*) globalCreateAndSetRandomPositionsAndVelocities() This function will create a given number of objects, all of the same particle type and set their positions and velocities to random values. Pass this function the number of particles to create, a seed for the random number generator, and true or false depending on if you want velocities to be randomized or zero.
*) getDistance() This is a static helper function that will return the distance between two vectors. Pass it the position of two particles and it will return their distance.

The Derived Particle Classes
There are derived particle classes for each of the three types of matter, Quarks, Leptons, and Bosons. These classes have protected constructors and cannot directly be instantiated. Instead, you'll create objects from classes that derive from these classes. A class inheritance diagram is provided below. Only the classes that inherit from Quark, Lepton, and Boson can be instantiated.


Inheritance Diagram. Click picture for larger image.

There is also an enumration called ColorCharge. This defines the color charge that quarks have. There is also a GluonColorCharge enumeration for gluons. The base class for all quarks, Quark, and the Gluon class have getColorCharge() and setColorCharge() methods for their ColorCharge.

The Fermion class serves as the base for the Quark and Lepton classes. Fermion has values for weak isospin, weak hypercharge, and generation. These values are set by the constructor of derived classes and can be obtained using the getWeakIsospin(), getWeakHyperCharge(), and getGeneration() methods.

Additionally, quarks have charm, strange, top, bottom, isospin, and baryon number values. These values are set by the derived quark classes and can be obtained with the methods getCharm(), getStrange(), getTop(), getBottom(), getIsospin(), and getBaryonNumber().

Similarly, leptons have leptonic electronic number, leptonic muonic number, and leptonic tauonic number values. These values are set by the derived lepton classes and can be obtained with the methods getLeptonicElectronicNumber(), getLeptonicMuonicNumber(), and getLeptonicTauonicNumber().

Using Custom Particles
Finally, we want to use our custom particles in an actual POOMA program. If you haven't done so already, you can download the test program from here and the custom particle file from here.

The test program creates a bunch of electrons with zero velocity and places them in an imaginary box. The electrons bounce around the box driven by their own repulsive force to each other. Every time step the positions of the electrons is printed to standard out.

Sunday, August 23, 2009

Getting POOMA Data For Use In Cocoa


POOMA ALife Data Running In An iPhone.

In the previous post we covered how to build the physics engine known as FreePOOMA on a Macintosh and how to write a simple Cocoa application that starts and stops POOMA. In this post we'll look at how to grab the data POOMA has calculated and use it in a Cocoa application.

Using C++ Code in Cocoa Objective C Programs
The first thing we need to do is enable the use of C++ code in a Cocoa program. There are two ways to do this.

The first way is to change the file extension of any Objective C file that needs to also use C++ from ".m" to ".mm". We did this in the example from the previous post.

The second way is to right click the file in the Groups & Files window and select Get Info from the popup menu. Then click the General tab. Find the section named File Type. You see a drop down list box there. Use the list box to change the file type to sourcecode.cpp.objcpp.

You only need to do one of these methods, not both.

Directly Grabbing FreePOOMA Domains
POOMA stores data in Engines and Engines have a Domain that contains the actual data. So for a given object, you want to grab its Domain in order to gain access to its data. The example below shows how to do this for a POOMA Array.

Domain<1, MyDataType>& oDomain = MyPOOMAArray.totalDomain();

As you can see, Domains are templates. The first template parameter specifies the number of dimensions in the Domain. The second template parameter specifies the data type the Domain stores. Once you have a Domain, you can pull data from it using the bracket operator, [], as shown below.

MyDataType& oMyData = oDomain[0];

From here you can perform any operation supported by the data type being used.

Parsing POOMA Data From Strings Programatically
Many POOMA objects can send their data to a stream. You can use this functionality to send POOMA data to a string stream, and then parse the resulting string. An example is shown below.

stringstream oStream;

oStream << MyPOOMAArray;

string strData = oStream.str();

parseString(strData); // custom function to parse the string and pull the needed data from it.

In the docs directory of the FreePOOMA install you will find tutorials in HTML format. Tutorial 11 discusses sending the data contained in POOMA objects to streams.

Parsing POOMA Data From Strings Manually
Finally, when debugging your program in XCode you can print POOMA data to the gdb console by sending it to the cout stream. You can then open the gdb console, copy the data and manually edit it to fit whatever format you need. Other programs can then use this data without the need to actually run POOMA. A code sample of how to do this is shown below.

cout << MyPOOMAArray; // Put a break point here.

In this case we put a breakpoint on the line of code shown above. Just before the code executes we open the gdb console and clear the log using the "Clear Log" button located at the upper right corner of the gdb console window. Then we step over the line of code shown above. Finally, we open the gdb console again and copy the resulting printout. Paste this information into TextEdit or some other editor and change it into the format you need to read it in your program.

The images below illustrate these steps. These images were taken while running a slightly modified version of the ALife example program provided with the FreePOOMA install.


Image 1. POOMA data in the gdb console. Click image for larger picture.


Image 2. The edited version of the gdb console data. It's now a C array. Click image for larger picture.

The movie at the beginning of this post shows the POOMA ALife data being used by an application running in an iPhone. Because we manually added the data to the program, FreePOOMA does not need to run on the iPhone.

Friday, August 21, 2009

Building POOMA on a Macintosh


FreePOOMA is an open source project for physics. The FreePOOMA web site describes the project like this:

FreePOOMA is a C++ library supporting element-wise, data-parallel, and stencil-based physics computations using one or more processors. The library automatically handles all interprocessor communication, obviating the need for any explicit communication code. The library supports high-level syntax close to mathematical or algorithmic syntax (like Fortran 95), easing the conversion from algorithms to code.

You can find the FreePOOMA project here: FreePOOMA web site
And a useful manual for the project here: POOMA manual

But the instructions for building FreePOOMA on a Macintosh cover the old CodeWarrior development environment. So this post will show the steps needed to build FreePOOMA on a modern Macintosh computer and create XCode projects that use FreePOOMA.

Getting FreePOOMA Source Code
To get the FreePOOMA source go to the download page and download their zipped tarball, or just click this link. Unzip the file using Stuffit Expander or a similar tool. UNIX geeks can open a terminal and type tar xzvf pooma-2.4.1.tgz.

Configure FreePOOMA
Before FreePOOMA can be built, it must be configured. To do this, follow these steps:

*) Open a terminal window. You can do this by typing "terminal" in Spotlight and starting the terminal application.
*) Use the "cd" command to change to the FreePOOMA root directory. The location of this directory is based on the location where you unziped the tarball. An example command would be cd /Users/[UserName]/Desktop/freepooma-2.4.1.
*) Type ./configure --arch LINUXgcc and hit return.
*) Type export POOMASUITE=LINUXgcc and hit return.
*) Type make and hit return.

This will create a file named PoomaConfiguration.h in the lib/LINUXgcc under your FreePOOMA directory.

We've now successfully created the FreePOOMA library! Navigate to the lib/LINUXgcc directory and look for a file named libpooma-gcc.a. This is the FreePOOMA library.

Creating A FreePOOMA XCode Project
Now we want to test using the FreePOOMA library in XCode. To do this, follow these steps:

*) Start Xcode and create a new Cocoa application project. Name the project.
*) Open a Finder window and navigate to the folder containing the libpooma-gcc.a FreePOOMA library.
*) Drag and drop the library file into your project. Check the option copy the file into the project.
*) Select the project icon at the top of the Groups & Files window.
*) Right click and select Get Info from the popup menu.
*) Select the Build tab.
*) Navigate to the Search Paths section of the build options.
*) Add a path to the FreePOOMA headers. Where this is located depends on where you downloaded the source code. Here is an example path: /Users/[UserName]/Desktop/freepooma-2.4.1/src
*) Click the "Recursive" check box so that all subdirectories will be searched.
*) Add a path to PoomaConfiguration.h. Where this is located depends on where you downloaded the source code. Here is an example path: /Users/[UserName]/Desktop/freepooma-2.4.1/lib
*) Click the "Recursive" check box so that all subdirectories will be searched.
*) Save these changes and exit the project info window.
*) Rename the file main.m to main.mm.

The above steps perform all the setup you need for using FreePOOMA in an XCode Cocoa application. Now lets write a sample app. Open the main.mm file and edit it so that it looks like the picture below (click the picture for a larger image):


Click the "Build and Go" button and step through the app to make sure everything is working.

Friday, August 14, 2009

More Better Redshift


I just received a response from NASA on the questions I raised in this post about redshift data that seemed incorrect. NASA responded that they have fixed the errors in the redshift data provided on their web pages. The new corrected data is shown in the chart above and looks much nicer.

The only flaws left are two different redshift values given for a distance of 12 BLY and redshift data for ACO 3341 which seems out of sync. The two different values for 12 BLY can be written off as a rounding error that occurs when the distance is simplified for the use in the press release. The ACO 3341 data was not provided by NASA. It was provided by the European Organization for Astronomical Research in the Southern Hemisphere (ESO). Just to wrap things up, I'll send them an e-mail and see if I can get an explanation or correction to their data, but things are looking pretty good now. LATE EDIT: Olivier Hainaut of the ESO has responded the redshift z and distance data released on the web page contained a typo and has been corrected. The page now gives the distance as "almost 500MLy". My thanks to him for taking the time to do this.

I'd like to thank the folks at the Chandra X-ray Observatory, Dr. Tom Bridgman, and reader jeant8 who is so smart she must work for NASA and if not, should, for working to clear up all this.

In the course of all this, some links to some pretty interesting Astronomy websites were provided. I'll reproduce those, along with sources for the new data, below.

Useful Links

The Sloan Digital Sky Survey http://www.sdss.org/ and http://www.sdss.org/dr7/products/spectra/index.html and http://cas.sdss.org/dr7/en/
The SDSS has a publicly accessible database of images and data for 25% of the sky. Proper use of this database requires a bit of skill but there are tutorials provided.

The ESA/ESO/NASA Photoshop FITS Liberator http://www.spacetelescope.org/projects/fits_liberator/
A Photoshop plugin for working with data in the FITS format. FITS data is what is produced by the SDSS public database.

NASA/IPAC Extragalactic Database http://nedwww.ipac.caltech.edu/
Data on extragalactic objects. Easier to use that SDSS.

Ned Wright's Cosmology Calculator
http://www.astro.ucla.edu/~wright/CosmoCalc.html and http://www.astro.ucla.edu/~wright/cosmolog.htm
A Javascript calculator for determining distance values based on different values for redshift z, the Hubble Constant, and the Omega M and Omega Vacuum constants. The second link provides an introduction to cosmology.

CDS http://cdsarc.u-strasbg.fr/cats/cats.html
A collection of tables and such taken from published astronomy papers.

THE HUBBLE CONSTANT http://www.cfa.harvard.edu/~huchra/hubble/
John Huchra's website explaining the Hubble constant

Communicating Astronomy with the Public http://www.capjournal.org/index.php
A journal devoted to communicating astronomy facts to the public.

Distance of Virgo, Coma and other clusters http://cdsads.u-strasbg.fr/abs/1990ApJ...350..110C and http://cdsads.u-strasbg.fr/abs/1991ASSL..169..451O and http://cdsads.u-strasbg.fr/abs/1996AAS...189.1204B and http://cdsads.u-strasbg.fr/abs/1997ApJ...483L..37T and http://arxiv.org/abs/astro-ph/0001402 and http://arxiv.org/abs/astro-ph/0512349
Papers discussing this issue.

NOTES
Redshift z values are multiplied by 10,000 in the charts I provided. This was done so they'd be on a similar scale to distance values, otherwise you wouldn't be able to see them in the charts that had scales large enough to show distances. Scaling the redshift z values in this way does not affect the results I discuss here.

DATA


REFERENCES
http://chandra.harvard.edu/photo/2003/perseus/
http://chandra.harvard.edu/photo/2009/stephq/
http://www.eso.org/gallery/v/ESOPIA/GalaxyClusters/phot-09i-02.jpg.html
http://chandra.harvard.edu/photo/2006/a400/
http://chandra.harvard.edu/photo/2002/0150/
http://chandra.harvard.edu/photo/1999/0087/
http://chandra.harvard.edu/photo/2003/abell2029/
http://chandra.harvard.edu/photo/2002/1182/
http://chandra.harvard.edu/photo/2006/clusters/
http://chandra.harvard.edu/photo/2006/4c37/
http://chandra.harvard.edu/photo/1999/0166/
http://chandra.harvard.edu/photo/2006/clusters/
http://chandra.harvard.edu/photo/2004/rdcs1252/
http://chandra.harvard.edu/photo/2003/4c41/
http://chandra.harvard.edu/photo/2005/smg/
http://chandra.harvard.edu/photo/2003/4c41/
http://chandra.harvard.edu/photo/2003/gb1508/

Saturday, August 8, 2009

Red Shift Z In The Wild II


Redshift Z and distance for 2003


Redshift Z and distance for 2006

Reader jeant8 commented that the unusual redshift values shown in my previous redshift post may be due to changes in the believed value of certain constants that occurred over the years that the data was collected. It's an interesting idea, and to test it I split out the years that had several observations posted by NASA. These were the years 2003 and 2006. The results are shown in the charts above. The data used for these charts is the same data used in the previous post.

The 2003 collection almost looks right. There's only one problem. Redshift values of 3.8 and 4.3 are both assigned to the distance of 12 billion light years. That's a change of ~12% in redshift z with no change in distance. There should be at least ~0.25 billion lights years difference between those two redshift z values.

The 2006 data seems to be more problematic. Not only are the curves not smooth there's actually the case where a low redshift is assigned to a much greater distance than two higher redshift values.

So it seems the problems with NASA's redshift values cannot be explained by changes over the years in redshift interpretation. Values from the same timeframe are inconsistent. It should be pointed out that not only do the values in the two charts presented here come from the same timeframe, they come from the same team of astronomers using the same equipment. That would seem to weed out a lot of possible explanations on why the data appears to be wrong.

Waiting For NASA

While I'm waiting to hear back from NASA about the questions I raised in my previous post, I put together the video below. Enjoy. :)

Thursday, August 6, 2009

Redshift Z In The Wild


Redshift z is used in astronomy to determine how far away an object is. The more the light from that object shifts to red, the farther away it is. Wikipedia has a good description of redshift.

While surfing NASA's site, I decided to record the redshift z and distance of objects when they were provided in the description. The distances of these objects ranged from 250 million light years away to 12 billion light years away.

What I found was rather surprising. The data don't seem to correlate very well. The redshift z doesn't seem to have an algorithmic relationship to distance.

You can see this for yourself in the charts above. The first chart shows redshift z as a blue line overlaying green distance bars. The two curves don't match up! The next two charts divide distance by redshift z and redshift z by distance. These two charts highlight that there is no smooth curve relating the values of redshift z and distance.

I also tried normalizing the redshift z and distance values to a scale of 0 to 1. This didn't change the results, as you can see in the image below.


I don't know if these numbers simply represent errors in the values provided on NASA's website, if there's something I'm misunderstanding, or if the redshift z theory really uses these unusual values. I think I'll shoot an e-mail to NASA and try to get an explanation.

Here is what the relationship between redshift z and distance looks like in theory. You can see how smooth the curve is in theory. Not at all what the curve looks like in practice.


Notes
Redshift z values are multiplied by 10,000 in the charts I provided. This was done so they'd be on a similar scale to distance values, otherwise you wouldn't be able to see them in the charts that had scales large enough to show distances. Scaling the redshift z values in this way does not affect the results I discuss here.

Data (Late Edit: By request, chart modified to include object names)


References
http://chandra.harvard.edu/photo/2003/perseus/
http://chandra.harvard.edu/photo/2009/stephq/
http://chandra.harvard.edu/photo/2006/a400/
http://www.eso.org/gallery/v/ESOPIA/GalaxyClusters/phot-09i-02.jpg.html
http://chandra.harvard.edu/photo/2002/0150/
http://chandra.harvard.edu/photo/1999/0087/
http://chandra.harvard.edu/photo/2003/abell2029/
http://chandra.harvard.edu/photo/2006/clusters/
http://chandra.harvard.edu/photo/2002/1182/
http://chandra.harvard.edu/photo/2006/clusters/
http://chandra.harvard.edu/photo/2006/4c37/
http://chandra.harvard.edu/photo/2006/clusters/
http://chandra.harvard.edu/photo/1999/0166/
http://chandra.harvard.edu/photo/2004/rdcs1252/
http://chandra.harvard.edu/photo/2003/4c41/
http://chandra.harvard.edu/photo/2005/smg/
http://chandra.harvard.edu/photo/2003/4c41/
http://chandra.harvard.edu/photo/2003/gb1508/
Wikipedia Cosmology Distance Measures