Thursday, February 4, 2010
A Note On UAH's High January Temperature
UAH just posted the satellite readings for January, and the result is the hottest January since UAH temperatures started in December, 1978. This has caused a bit of discussion in the skeptic community. I think a lot of people are thinking “With all the cold we had last month in the northern hemisphere, how could this be the warmest January in the last 30 years? Is it possible the satellite readings are wrong?”
Yes. It’s possible the satellite readings are wrong.
As it travels around the Earth, the AMSU (the instrument used to read what becomes UAH temperature anomalies) reads 30 scans in the direction perpendicular to its orbit. Two of these scans are directly below the satellite and the each of the other 28 get progressively farther and farther away from the satellite in both the port and starboard directions. The further away from the satellite, the larger the error in its temperature readings.
Note that I didn’t say possible error. There’s no question at all these other 28 readings are wrong. The amount of error can be as high as 30 degrees Kelvin.
These errors are corrected via software. For each channel, the software checks the two neighboring channels and previous readings. This procedure is called a “Limb Adjustment”. I have a short discussion of this in the “Adjusting Footprint Brightness” section of the post I made here, and you can find a full technical discussion of the issue here.
Unfortunately, the Limb Adjustment uses statistical techniques to determine the adjustment values for each footprint, not the hardcoded technique I discussed in my blog post. It’s possible these statistical techniques fail in the face of unusual weather events like what we saw this January.
But without having access to the source code, I can’t tell if these unexpectedly high readings are due to a statistical error in the software calculations or are actually correct.
References:
Some Useful Climate Code
The Limb Adjustment of AMSU-A Observations: Methodology and Validation
Climate Scientist Starter Kit v2.0 Coming
Behind these scenes I've been working on an update to the Climate Scientist Starter Kit. The new version will be 2.0. It's still a ways off, but I wanted to do a series of articles about some of the new things it'll contain. In this post, we'll look at three new datasets that will be added: Length Of Day Delta and the Solar and Lunar Ephemeris.
Length Of Day Delta (LODD)
 I've made a couple of posts already about the Length of Day Delta (LODD) (see here and here). The LODD tells us how many more milliseconds are added to the average length of day of 86,400 seconds each day.
It turns out that the LODD has some interesting correlations to several more common climate factors, including the global amount of Earth's water vapor. It's possible that by learning more about what causes changes in the LODD, we'll learn more about what causes changes in these other climate factors.
The LODD data comes from The Earth Orientation Centre. Below is a graph of the LODD data that will appear In the new Climate Scientist Starter Kit. It shows monthly LODD data from January, 1962 through December, 2009 with a 13 month running mean added.

Solar And Lunar Ephemeris
 The solar and lunar ephemeris data gives the location of the sun and moon in relationship to the Earth. It's well known that lunar ephemeris data is closely related to Earth's tides. Solar ephemeris data has a 12 month cycle that corresponds to cycles that appear repeatedly in climate data.
Both sets of data provide data from January, 1900 to December, 2009. The data is obtained from the NASA Jet Propulsion Laboratory. The graph below shows solar ephemeris data from January, 1980 through December, 2009.

Normalized Data Included
One of the nice things about the Climate Scientist Starter kit is that it includes versions of most of the data that have been normalized to a range of zero to one. This makes it easy to compare data from very different data sets. The new data being added to version 2.0 continues this tradition. The graph below shows monthly LODD data mapped together with solar ephemeris data using the normalized version of both data sets.

More To Come
There are many more types of data being added to version 2.0 of the Climate Scientist Starter Kit. We'll cover those in future posts. If there's something you'd like added, leave a note in the comments and I will do my best to add it.
References:
Climate Scientist Starter Kit
Stunning New Climate Correlation
More On Water Vapor, Length Of Day Delta Correlation
The Earth Orientation Centre
NASA Jet Propulsion Laboratory
Length Of Day Delta (LODD)

It turns out that the LODD has some interesting correlations to several more common climate factors, including the global amount of Earth's water vapor. It's possible that by learning more about what causes changes in the LODD, we'll learn more about what causes changes in these other climate factors.
The LODD data comes from The Earth Orientation Centre. Below is a graph of the LODD data that will appear In the new Climate Scientist Starter Kit. It shows monthly LODD data from January, 1962 through December, 2009 with a 13 month running mean added.

Solar And Lunar Ephemeris

Both sets of data provide data from January, 1900 to December, 2009. The data is obtained from the NASA Jet Propulsion Laboratory. The graph below shows solar ephemeris data from January, 1980 through December, 2009.

Normalized Data Included
One of the nice things about the Climate Scientist Starter kit is that it includes versions of most of the data that have been normalized to a range of zero to one. This makes it easy to compare data from very different data sets. The new data being added to version 2.0 continues this tradition. The graph below shows monthly LODD data mapped together with solar ephemeris data using the normalized version of both data sets.

More To Come
There are many more types of data being added to version 2.0 of the Climate Scientist Starter Kit. We'll cover those in future posts. If there's something you'd like added, leave a note in the comments and I will do my best to add it.
References:
Climate Scientist Starter Kit
Stunning New Climate Correlation
More On Water Vapor, Length Of Day Delta Correlation
The Earth Orientation Centre
NASA Jet Propulsion Laboratory
Wednesday, February 3, 2010
Some Useful Climate Code
I'd hoped to post a C++ AMSU HDF-EOS Level 1B (man, that's a mouthful) reader today. But I'm having trouble locating some of the libraries the downloaded sample code needs. I may have to re-write the reader myself.
So in the meantime I figured I'd post a few useful utilities I've come across while writing this series of posts.
Previous Posts In This Series
Compute Radiance From Frequency And Temperature
This code converts a reading in degrees Kelvin and a frequency value to a radiance value. Radiance is given in units of milliwatts/m2 cm-1. The original C code can be found in the file read_chan_props.c in the C Readers Code provided by NASA. The example here uses pseudocode.
Adjusting Footprint Brightness
Recall that the AMSU scans 30 footprint readings per scan line. Because theses readings are done with the satellite in the same position, footprints to the far left and far right will be at different heights in the atmosphere than readings directly below the satellite. A visual example of these offsets is shown in the diagrams below. Diagram A shows the offsets for channels 1-3, and 15. Diagram B shows the offsets for the other AMSU channels.


These offsets cause a deviation in the brightness values for each footprint. These deviations are shown in the diagram below. The X axis shows the footprint readings. The Y axis shows the variations in brightness that occur at each footprint for each channel.

The values in this chart can be used to adjust the brightness readings of each footprint in a scan line of the AMSU.
These diagrams, as well as a more complicated way of adjusting brightness values, are provided in The Limb Adjustment of AMSU-A Observations: Methodology and Validation.
Pseudocode for using the brightness adjustment diagram provided here is shown below.
NOTE: These adjustments should be done to the Brightness values, not the antenna values.
References:
C AMSU Level 1B Swath and Grid Readers
The Limb Adjustment of AMSU-A Observations: Methodology and Validation
So in the meantime I figured I'd post a few useful utilities I've come across while writing this series of posts.
Previous Posts In This Series
Compute Radiance From Frequency And Temperature
This code converts a reading in degrees Kelvin and a frequency value to a radiance value. Radiance is given in units of milliwatts/m2 cm-1. The original C code can be found in the file read_chan_props.c in the C Readers Code provided by NASA. The example here uses pseudocode.
Function ComputeRadiance

   Parameter Temperature Of Type Double

   Parameter Frequency Of Type Double

   Return Value Radiance Of Type Double

Begin Function

   Constant PLANCKS_CONSTANT Equals 6.62620e-34

   Constant SPEED_OF_LIGHT Equals 2.99793e+10-34

   Constant BOLTZMANS_CONSTANT Equals 1.38062e-23

   Constant PLANK_CONSTANT_1 Equals 2.0 * (PLANCKS_CONSTANT) * (SPEED_OF_LIGHT) * (SPEED_OF_LIGHT) * 1.e7

   Constant PLANK_CONSTANT_2 Equals (PLANCKS_CONSTANT) * (SPEED_OF_LIGHT) /

(BOLTZMANS_CONSTANT)


   Return PLANK_CONSTANT_1 * Frequency * Frequency * Frequency / (Exponent(PLANK_CONSTANT_2 * Frequency / Temperature) - 1.0)

End Function
Adjusting Footprint Brightness
Recall that the AMSU scans 30 footprint readings per scan line. Because theses readings are done with the satellite in the same position, footprints to the far left and far right will be at different heights in the atmosphere than readings directly below the satellite. A visual example of these offsets is shown in the diagrams below. Diagram A shows the offsets for channels 1-3, and 15. Diagram B shows the offsets for the other AMSU channels.


These offsets cause a deviation in the brightness values for each footprint. These deviations are shown in the diagram below. The X axis shows the footprint readings. The Y axis shows the variations in brightness that occur at each footprint for each channel.

The values in this chart can be used to adjust the brightness readings of each footprint in a scan line of the AMSU.
These diagrams, as well as a more complicated way of adjusting brightness values, are provided in The Limb Adjustment of AMSU-A Observations: Methodology and Validation.
Pseudocode for using the brightness adjustment diagram provided here is shown below.
Foreach Channel

   Foreach Footprint

      Subtract Channel/Footprint Adjustment Value From Channel Brightness Reading

   End Foreach

End Foreach
NOTE: These adjustments should be done to the Brightness values, not the antenna values.
References:
C AMSU Level 1B Swath and Grid Readers
The Limb Adjustment of AMSU-A Observations: Methodology and Validation
Tuesday, February 2, 2010
More On Water Vapor, Length Of Day Delta Correlation
I downloaded The official Length of Day Delta (LODD) data so that I could do a more detailed analysis on the correlation between water vapor and the LODD I discussed here. I parsed up the data and added it to my working copy of the Climate Scientist Starter Kit Spreadsheet.
What I found is the correlation is not as good as I first thought it was. Or maybe a better way to say it is the correlation is different than I first thought it was. There seems to be two correlations in the data.
Just to be clear, I'm not suggesting that changes in the LODD are causing changes in water vapor. I'm pointing out that there are correlations between the two data sets.
What Is Length Of Day Delta (LODD)?
Let's start with an explanation of what the Length Of Day Delta (LODD) is. Simply put, the LODD is a measure of how much extra time is added to each day. A "normal" day has 86,400 seconds. However, in practice, there's no such thing as a normal day. Each day has a few more or a few less milliseconds. The extra amount of time, which can be positive or negative, is the LODD.
Water Vapor And LODD, 1983 To 2008
 The graph above shows water vapor (blue lines) and LODD (green lines) data for the period of July, 1983 to June, 2008. There's a 13 month running mean added to smooth the data.
As you can see, the correlation doesn't look as nice as when I just overlaid two graphs in my previous post. Specifically, in the early years water vapor is not matching LODD. I was a bit bummed out when I saw this, thinking a correlation that looked so promising turned out to be nothing.
But I kept looking and found something else: two correlations.
Water Vapor And LODD, 1983 To 1997
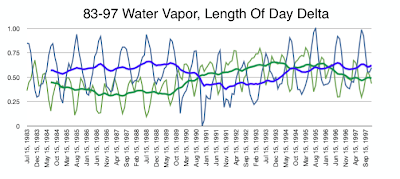 The first correlation runs through the first half of the data, from July 1983 to December, 1997. In this correlation the water vapor (blue lines) and LODD (green lines) are mirror images of each other. As one goes up, the other goes down. This is true both at the monthly level and at the 13 month smoothed trend.
Water Vapor And LODD, 1998 To 2008
 The second correlation runs through the second half of the data, from January, 1998 to June, 2008. In this correlation water vapor (blue lines) and LODD (green lines) follow each other in the 13 month smoothed trend, even though at the monthly level they are still have reversed trends.
What's It All Mean?
The honest answer is "I don't know". Maybe there's something to this, maybe not. But the two correlations seem pretty clear.
One thing that jumps out at me is that 1998, when the new smoothing trend starts, is when the Earth stopped warming.
I'll continue to research this to see what I find and post updates here.
References:
Earth Orientation Centre Length of Day Delta (LODD) data
Stunning New Climate Correlation
Climate Scientist Starter Kit Spreadsheet
What I found is the correlation is not as good as I first thought it was. Or maybe a better way to say it is the correlation is different than I first thought it was. There seems to be two correlations in the data.
Just to be clear, I'm not suggesting that changes in the LODD are causing changes in water vapor. I'm pointing out that there are correlations between the two data sets.
What Is Length Of Day Delta (LODD)?
Let's start with an explanation of what the Length Of Day Delta (LODD) is. Simply put, the LODD is a measure of how much extra time is added to each day. A "normal" day has 86,400 seconds. However, in practice, there's no such thing as a normal day. Each day has a few more or a few less milliseconds. The extra amount of time, which can be positive or negative, is the LODD.
Water Vapor And LODD, 1983 To 2008

As you can see, the correlation doesn't look as nice as when I just overlaid two graphs in my previous post. Specifically, in the early years water vapor is not matching LODD. I was a bit bummed out when I saw this, thinking a correlation that looked so promising turned out to be nothing.
But I kept looking and found something else: two correlations.
Water Vapor And LODD, 1983 To 1997

Water Vapor And LODD, 1998 To 2008

What's It All Mean?
The honest answer is "I don't know". Maybe there's something to this, maybe not. But the two correlations seem pretty clear.
One thing that jumps out at me is that 1998, when the new smoothing trend starts, is when the Earth stopped warming.
I'll continue to research this to see what I find and post updates here.
References:
Earth Orientation Centre Length of Day Delta (LODD) data
Stunning New Climate Correlation
Climate Scientist Starter Kit Spreadsheet
Monday, February 1, 2010
Stunning New Climate Correlation
I just discovered this and simply had to post it. It's an amazing correlation between water vapor in the Earth's atmosphere and changes in the Earth's rotation measured in milliseconds! I know. I know. It's insane to think changes of a few milliseconds could somehow be related to the total water vapor in the air. But here's the chart:
 The blue line is changes in the Earth's rotation as measured in milli-seconds. The red line is changes in the total amount of water vapor in the Earth's atmosphere. The graph covers a 24 year period from 1983 through 2007.
The information for changes in the Earth's rotation comes from the U.S. Naval Observatory. The information for changes in the Earth's water vapor comes from the International Satellite Cloud Climate Project. You can graph the cloud data using the Climate Scientist Starter Kit and your favorite spreadsheet program.
I don't know what this means yet. As I said, I only just now discovered it. But I wanted to get the information out there so people can see it.
Rest assured that future posts will look into this more deeply.
References:
U.S. Naval Observatory Leap Seconds
International Satellite Cloud Climate Project
Climate Scientist Starter Kit
Summary Of Aqua Satellite Data, Computer Code, And Broken Equipment
Availability Of Satellite Data And Associated Computer Code
The following tables sum up the availability of data and computer code used to produce the UAH, RSS, and AMSR-E information we've been discussing in this series of articles.
Notes
1 UAH and AMSR-E Level 0 data is available for a 4 day window from the University of Wisconsin. However, there seems to be no read permissions allowed to guest accounts for files other than 00README.txt.
2 Computer source code to read and write various versions of HDF-EOS files is publicly available. However, this code does not actually process climate data.
Broken Satellite Equipment
The following tables sum up the satellite equipment used to produce the UAH, RSS, and AMSR-E information that has broken over time.
The following tables sum up the availability of data and computer code used to produce the UAH, RSS, and AMSR-E information we've been discussing in this series of articles.
| UAH Data | Available To Public |
| Data Transmitted From Satellite To Ground | No |
| Level 0 Data | Partial1 |
| Level 1A Data | No |
| Level 1B Data | Yes |
| Level 2A Data | Yes |
| UAH Computer Code | Available To Public2 |
| Process Satellite Data To Level 0 | No |
| Process Level 0 To Level 1A | No |
| Process Level 1A To Level 1B | No |
| Process Level 1B To Level 2A | No |
| RSS Data | Available To Public |
| Data Transmitted From Satellite To Ground | No |
| Level 0 Data | No |
| Level 1A Data | No |
| Level 1B Data | No |
| Level 2A Data | No |
| RSS Computer Code | Available To Public2 |
| Process Satellite Data To Level 0 | No |
| Process Level 0 To Level 1A | No |
| Process Level 1A To Level 1B | No |
| Process Level 1B To Level 2A | No |
| AMSR-E Data | Available To Public |
| Data Transmitted From Satellite To Ground | No |
| Level 0 Data | Partial1 |
| Level 1A Data | Yes |
| Level 1B Data | No |
| Level 2A Data | Yes |
| AMSR-E Computer Code | Available To Public2 |
| Process Satellite Data To Level 0 | No |
| Process Level 0 To Level 1A | No |
| Process Level 1A To Level 1B | No |
| Process Level 1B To Level 2A | Yes |
Notes
1 UAH and AMSR-E Level 0 data is available for a 4 day window from the University of Wisconsin. However, there seems to be no read permissions allowed to guest accounts for files other than 00README.txt.
2 Computer source code to read and write various versions of HDF-EOS files is publicly available. However, this code does not actually process climate data.
Broken Satellite Equipment
The following tables sum up the satellite equipment used to produce the UAH, RSS, and AMSR-E information that has broken over time.
| Broken UAH Equipment |
| Channel 7 |
| Broken RSS Equipment |
| Unknown |
| Broken AMSR-E Equipment |
| Hot Load |
| Horn A |
References And Additional Posts In This Series
Aqua Satellite Raw AMSR-E Data
In this post we take a look at the AMSR-E Level 2A data. Specifically, we now want to be able to write pseudocode that reads the file, checks for errors, and grabs the raw temperature data. In order to get to this level of understanding of the data, we're going to use the Level 2A Data Fields web page. It describes the fields in the Level 2A data file for the AMSR-E instrument.
Additional Posts In This Series
Aqua Satellite Data ProcessingA Note On The UAH And RSS Raw Data
How UAH And RSS Temperatures Are Measured
Overview Of The Aqua Satellite
Looking At The Aqua Satellite Data
UAH Satellite Data
Dangit! More Climate Stuff. UAH and RSS Raw Data

Each AMSR-E Level 2A data file contains a singe scan at low resolution and a single scan at high resolution.
For low resolution, the AMSR-E scans 1994 times in the same direction as the satellite is moving. Each of these 1994 scans contains 243 readings perpendicular to the movement of the satellite (called Footprints), and each of these 243 readings contains 5 channels, each at a different frequency.
This gives a total of 2,422,710 readings in a single Level 2A file. This data has been "smoothed" as part of its processing from Level 1B to Level 2A.

For high resolution scans the AMSR-E scans 1994 times in the same direction as the satellite is moving. Each of these 1994 scans contains 486 readings perpendicular to the movement of the satellite, and each of these 486 readings contains 1 channel at a frequency of 89.0 GHz.
This gives a total of 969,084 readings in a single Level 2A file. This data has not been smoothed. It's in its original Level 1B form.
NOTE: The high resolution scans were designed to be collected by two "horns" on the AMSR-E instrument, called Horn A and Horn B. However, recall from this post that Horn A failed on November 11th, 2004. A software change was made to gather all high resolution data from Horn B. Horn A still has data fields in the level 2A file, but they are all set to -32,768.
NOTE: Both the low resolution and high resolution temperatures are stored in a scaled offset format. To obtain the actual temperature in degrees Kelvin multiply the stored values by 0.01 and add 327.68 to the result.
Data Quality
There are several fields in the AMSR-E Level 2A data file that contain the results of Quality Assurance (QA) checks. These fields tell if various pieces of data in the file can be used with confidence. Here are the important QA fields to check when processing temperature data:
For Low Resolution Scans
- Scan Quality Flag A series of 1994 flags indicating the quality of each scan line. If a flag is not zero, the corresponding scan line should be rejected.
- Channel Quality Flag 6 To 52 A series of 1994 arrays containing 12 flags each. There are two flags for channels 6.9, 10.7, 18.7, 23.8, and 36.5. The last two fields are not used as there is no channel 52. These flags indicate the horizontal and vertical scan validity for each scan footprint. If either flag for a footprint is not zero, the corresponding footprint should be rejected.
For High Resolution Scans
There are two high resolutions scans in the Level 2A file, one for Horn A and one for Horn B. Horn A is broken and its data should be ignored.
- Scan Quality Flag 89B A series of 1994 flags indicating the quality of each scan line for Horn B. If a flag is not zero, the corresponding scan line should be rejected.
- Channel Quality Flag 89B A series of 1994 arrays containing 2 flags each. These flags indicate the horizontal and vertical scan validity for each scan footprint. If either flag for a footprint is not zero, the corresponding footprint should be rejected.
Pseudocode For Reading Raw AMSR-E Data
The following pseudocode shows how to process a AMSR-E Level 2A file, checking for QA errors, and grabbing the temperature data. Recall that temperatures are provided in scaled offset degrees Kelvin and that Horn A is always bad.
Open File

Read Low Resolution Record Into Memory


Foreach Of The 1994 Scanlines

   If Scan Quality Flag Is Not 0 Then Reject Scanline


   Foreach Of The 5 Footprints

      If Either Of The Channel Quality Flags Are Not 0 Then Reject Footprint


      Read Each Of The 243 Footprints For the Channel

   End Foreach

End Foreach


Read High Resolution Horn B Record Into Memory


Foreach Of The 1994 Scanlines

   If Scan Quality Flag Is Not 0 Then Reject Scanline


   If Either Of The Channel Quality Flags Are Not 0 Then Reject Footprint


   Read Each Of The 486 Footprints For the Channel

End Foreach
References:
Subscribe to:
Posts (Atom)

